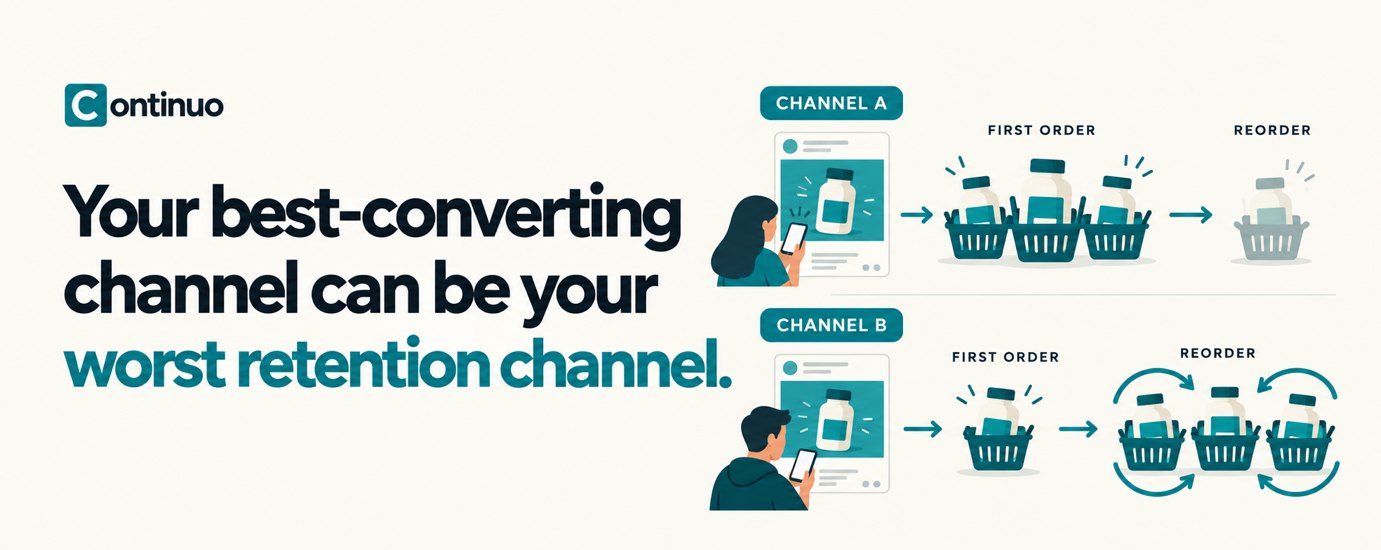
One channel converts more visitors. It costs less to acquire each customer. The first-order numbers look strong.
You increase the budget. More customers arrive. Then the repeat-purchase rate starts slipping.
The obvious response is to inspect the post-purchase flows. But there is another question worth asking: did the experience deteriorate, or did the mix of customers change?
In Article 1, we treated “customers aren’t coming back” as a symptom that needs diagnosis. Acquisition is one place to begin that investigation.
The first order can give you an incomplete winner
Imagine a supplement brand comparing two channels. The figures below are illustrative, not client results or industry benchmarks. Each group contains 1,000 new customers acquired in the same period, with a full 90 days of observation after each first purchase.
| Measure | Channel A | Channel B |
|---|---|---|
| First-order conversion rate | 4.0% | 2.5% |
| Acquisition cost per new customer | $20 | $32 |
| Customers placing a second order within 90 days | 150 of 1,000 15% | 400 of 1,000 40% |
| 90-day net revenue per acquired customer | $60 | $90 |
| 90-day variable costs per acquired customer Excluding acquisition | $30 | $42 |
| 90-day contribution after acquisition cost Per acquired customer | $10 | $16 |
Channel A wins on first-order conversion and costs less to acquire each customer. But over the next 90 days, more of Channel B’s customers return, and they generate more revenue per customer.
Even after accounting for product, fulfilment and acquisition costs, Channel B leaves the business with more money per customer.
That remaining money still needs to cover overhead, so it is not net profit. And this comparison captures only the first 90 days, not the customer’s full lifetime value.
A changing customer mix can look like failing retention
The example also explains how the overall repeat-purchase rate could decline without either channel getting worse.
With equal numbers from A and B, the combined 90-day second-order rate is 27.5%. If a later, equally mature cohort is 80% from A and 20% from B, the combined rate becomes 20%, even if A stays at 15% and B stays at 40%.
The overall rate fell because more customers came from the lower-repeat group. Rewriting every flow would not address that change in acquisition mix.
Make the comparison fair before interpreting it
Group customers by acquisition source and first-order period. Keep each customer in that original group when counting later purchases. A customer acquired through paid social who reorders through email still belongs to the original acquisition cohort.
Before you rebuild the flows
Take your two largest acquisition sources. Compare customers acquired in the same period, giving each a full 90 days after their first order. Look at who buys again, how much they spend and what remains after variable costs and acquisition.
If the results differ, you have a place to investigate. What did those customers buy? What brought them in? What were they expecting?
That is the question Continuo will keep returning to: what brings your customers back, and what gets in their way?
Before your next acquisition budget review, put repeat purchase beside conversion rate. Does the same channel still look like the winner?